Site map

Help us make USS better for everyone; join our research community

Value for money

Delivering value for money is a key focus for the scheme and our performance in this area is reviewed in depth by the Trustee Board on an annual basis

...and we score well in each area

  • Cost efficiency table

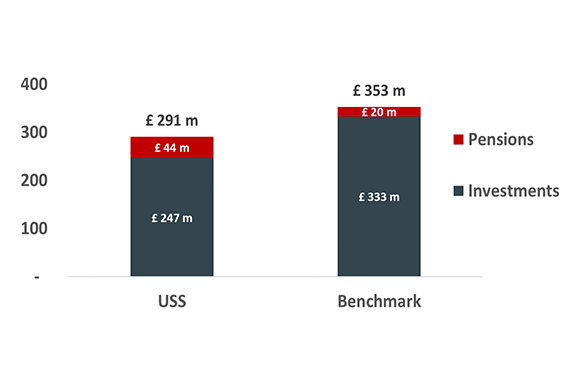
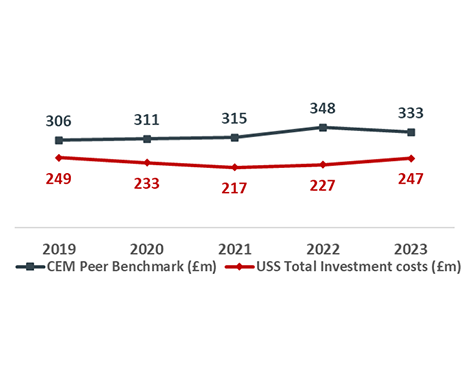
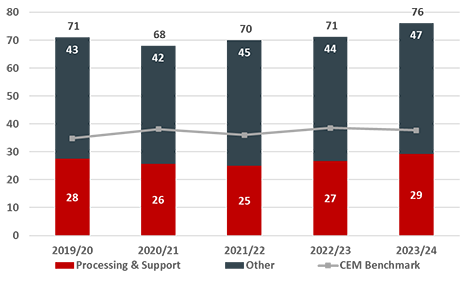
    We are significantly less expensive in total than our peer group*

    CEM (a leading independent benchmarking organisation) compares us to a peer group. In the latest available comparison (2022), we were significantly less expensive in total than our peer group (£102m or 13bps). The substantial advantage in Investments more than offsets the higher Pension Administration/Scheme Governance cost.

    *costs are presented on the CEM Benchmarking basis. Scheme Costs reported in the CFO section of the Annual Report and Accounts are £231m.

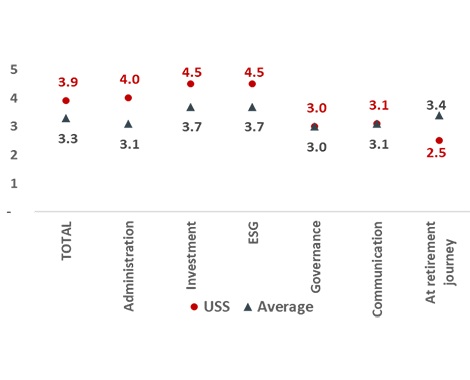
  • We scored 3rd highest for member service overall

    CEM scored us 3rd highest overall compared to our peer pension administration group in the latest survey and very close to the top two (our score was 70 out of 100, above the peer median of 66).

  • DB and DC balanced scorecards rated "Good"

    We introduced the DB investment balanced scorecard in 2022, with the DC scorecard introduced in 2023. This allows the trustee to holistically assess USSIM’s investment and advisory performance.

    You can see how the Investment Committee assessed USSIM’s performance on our investment balanced scorecard pages.

    Learn more about the DB scorecard

    Learn more about the DC scorecard

We score well in a global pensions transparency benchmark, with a rating of 78 compared with a UK average of 64

To ensure we inform stakeholders about how their scheme is managed, we provide updates including investment and cost performance via a range of published and face-to-face mechanisms. Top1000funds.com/CEM Benchmarking reports that we provide a greater level of transparency of disclosures compared with a peer group of 75 pension funds from 15 countries. We received a transparency rating of 78, compared with a UK average of 64 and a global average of 60. The analysis considered performance, governance, cost, responsible investing, and integrated reporting disclosures.